Debugging
Follow the below steps to setup your VS Code environment for debugging:
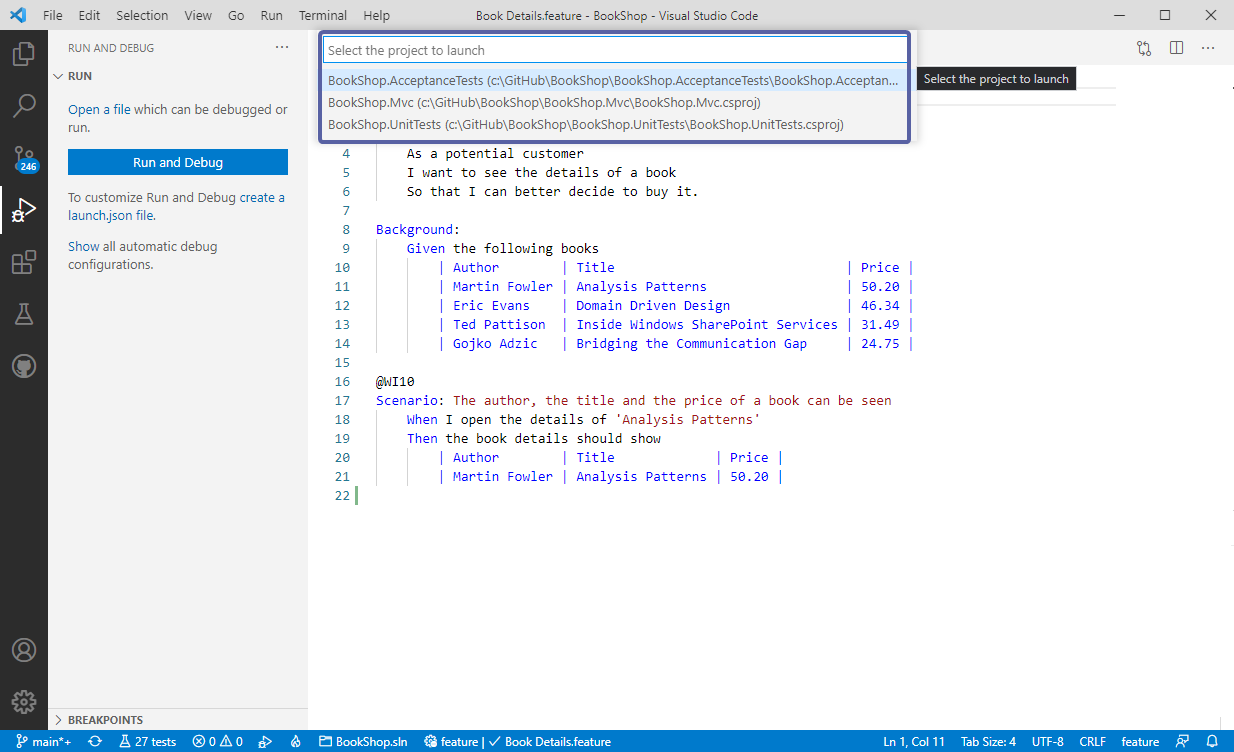
1- Click on the Run and Debug (Ctrl + Shift + D) button on the left pane and then click on Create a launch.json file. VS Code will then ask you what kind of environment you want to debug, select .NET Core:

Next, you will have to choose the project you want to debug. Select the project and VS Code will then create a launch.json
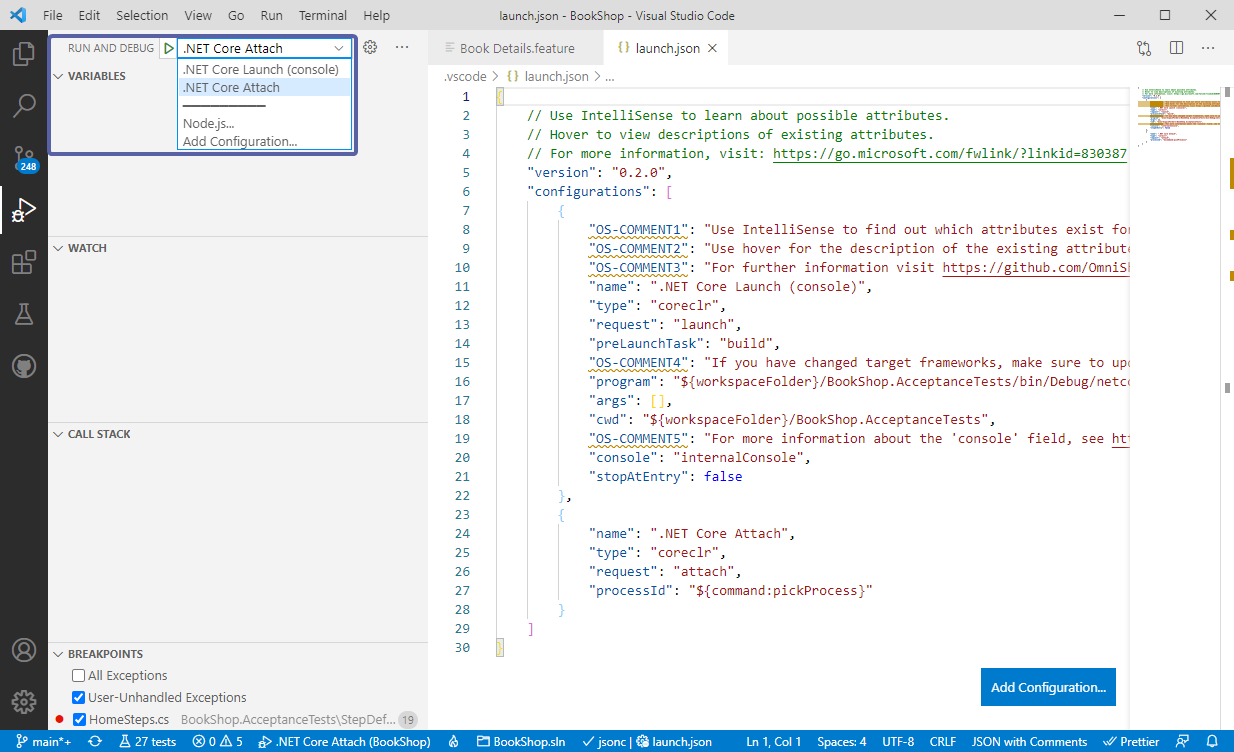
2- Once the launch.json file is created by VS Code you will see the debug options on the left pane. There are two debug operations to choose from here, .NET Core Launch (Consosle) which is for console applications and .NET Core Attach which is what we are going for in this example, Select .NET Core Attach.
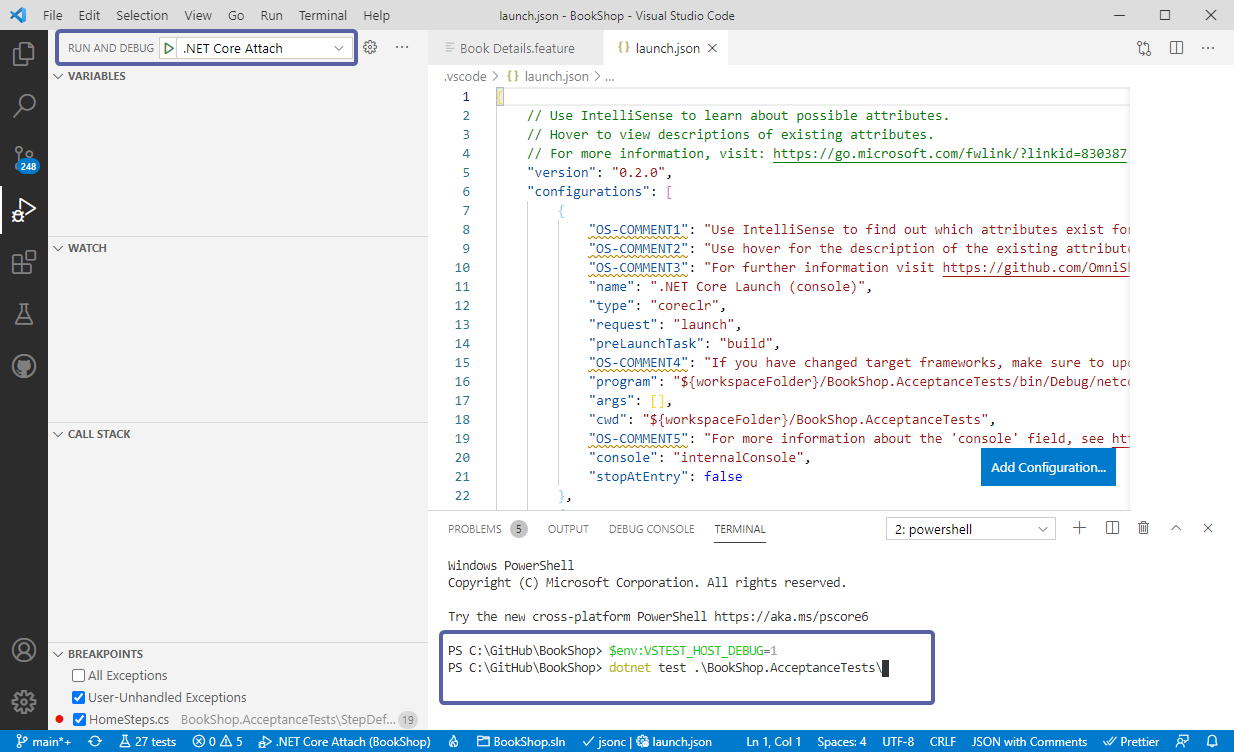
3- Open a new Terminal and enter the below into the terminal and hit Enter to set it up for debugging:
$env:VSTEST_HOST_DEBUG=1
The terminal is now ready for debugging, Enter dotnet test followed by your project and hit Enter:
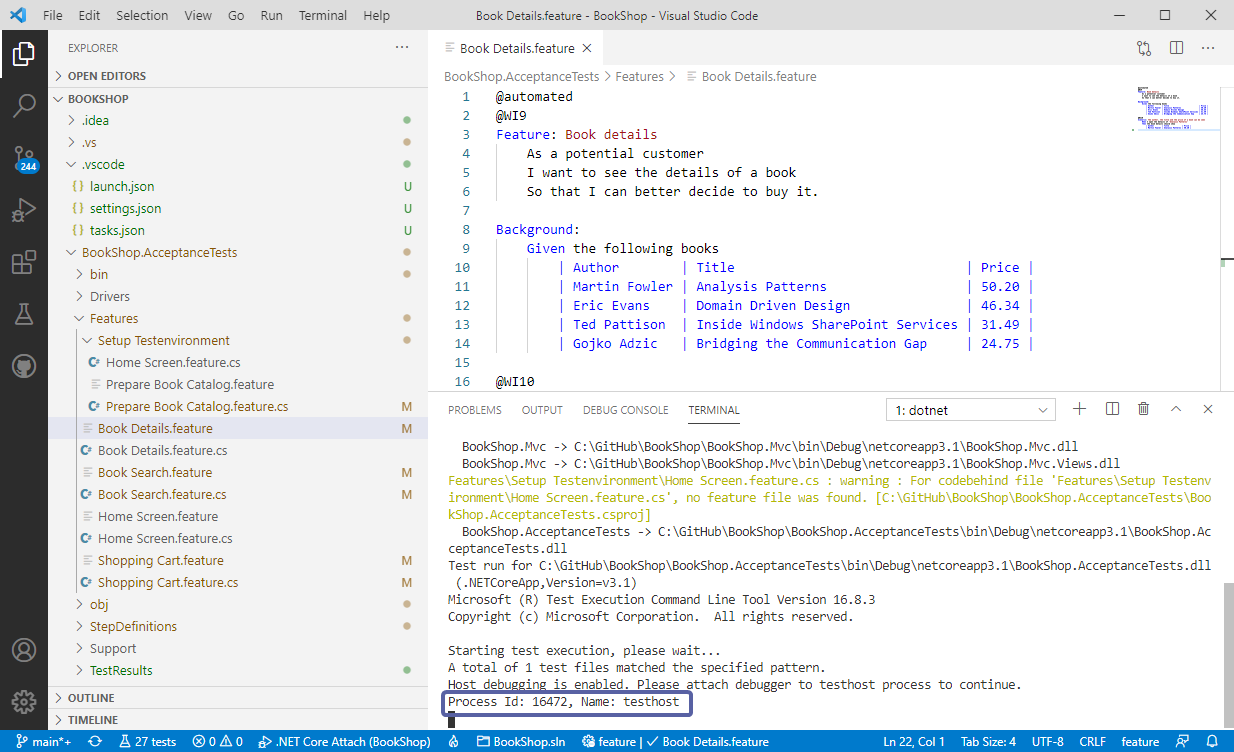
4- dotnet test will then start in debug mode and display the test host process ID on which you can attach the debugger to:
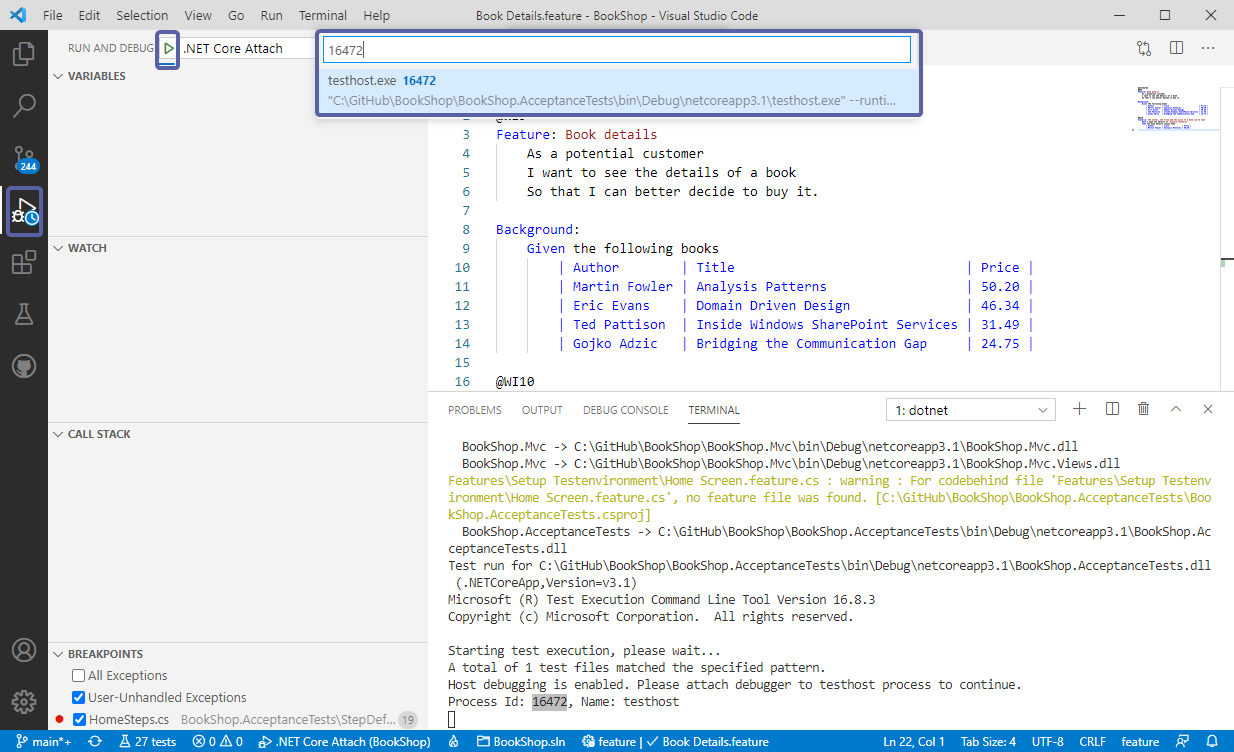
5- Copy the process ID number and navigate back to debug menu on the left pane and click on the ▶ icon next to .NET Core Attach and paste the process ID number in the displayed search box and select testhost.exe:
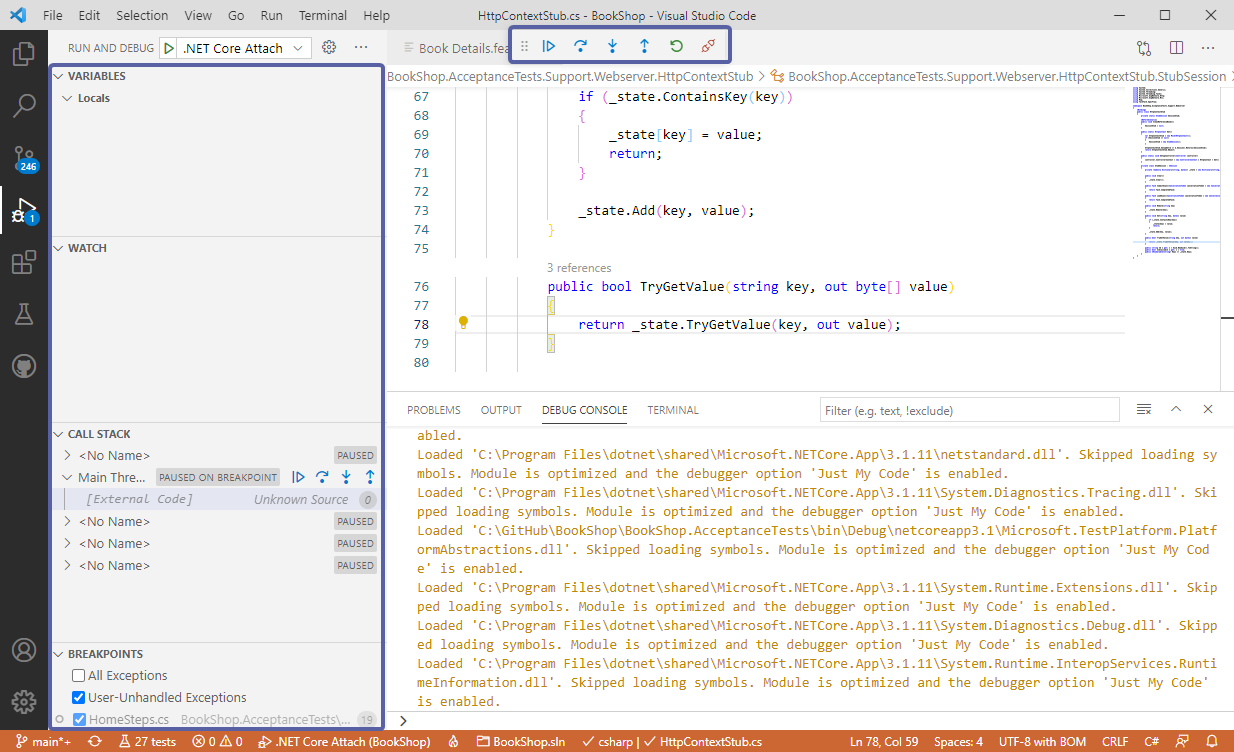
6- The debugger menu will then open up and you can see additional debugging options:
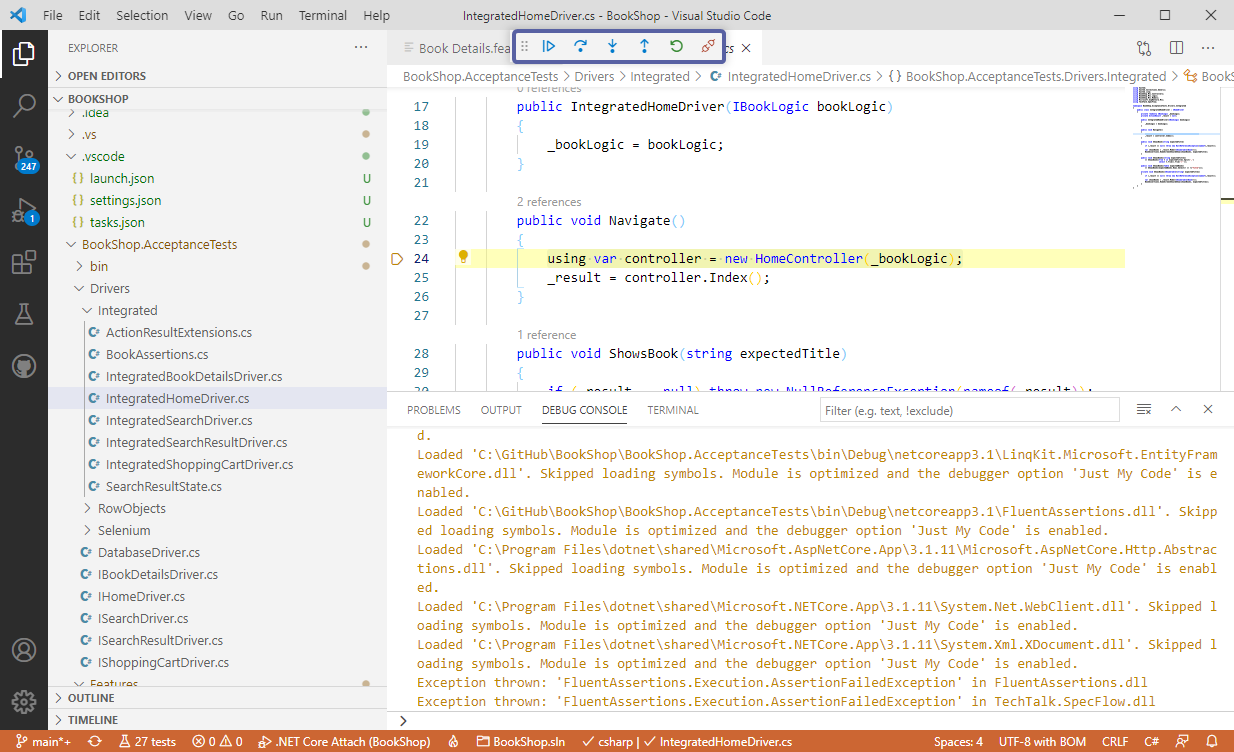
7- Now would be a good time to navigate to your files and set your break points before hitting the start button the menu:
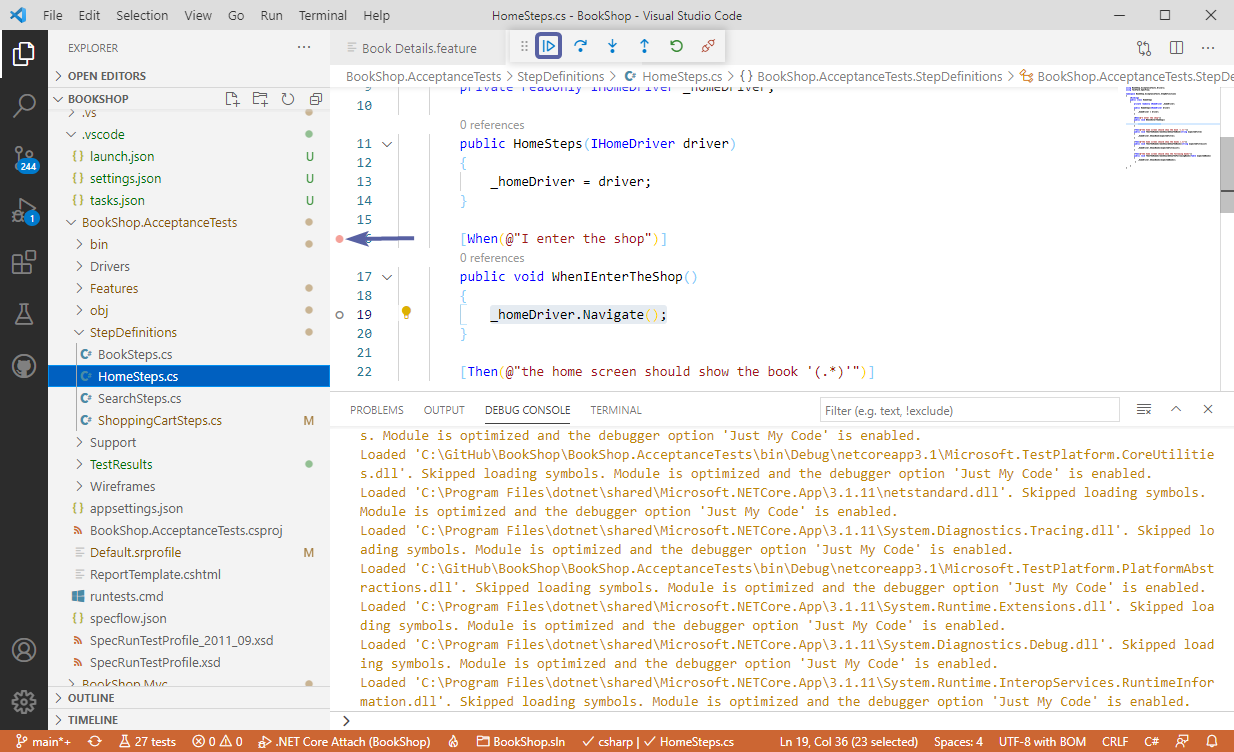
8- The debugger menu buttons give you the options to navigate around and once finished you can disconnect by using the red unplug button: